
Reports
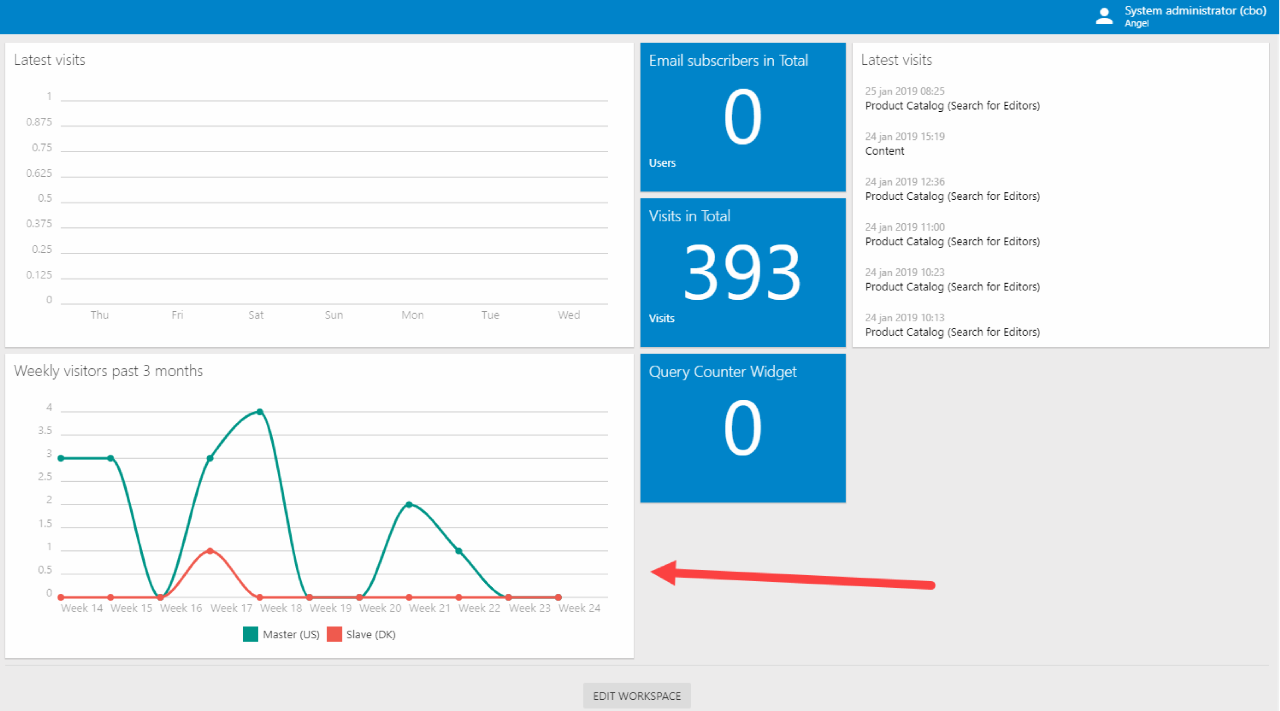
The Reports node allows you to generate various types of reports based on tracking information – e.g. weekly sessions per website, yearly sessions per platform, and so on. Once created, the report can be visited directly or exported as a dashboard widget to the marketing dashboard (Figure 1.1).
Reports are dependent on tracking being enabled under Settings > Web and HTTP > Tracking.
To create a new report:
- Open the Marketing area
- Right-click the Reports node or one of its subfolders
- Click Create new report
- Provide a widget title
- Select a report type
- Conversion reporting reports on how e.g. a particular page, device type or referrer performs in regards to a specific conversion such as Cart.Created or Form.View
- Funnel reporting reports on how many sessions complete various steps in a flow, e.g. Cart.Created and Cart.Complete.
- Session reporting
- Configure the parameters belonging to that type
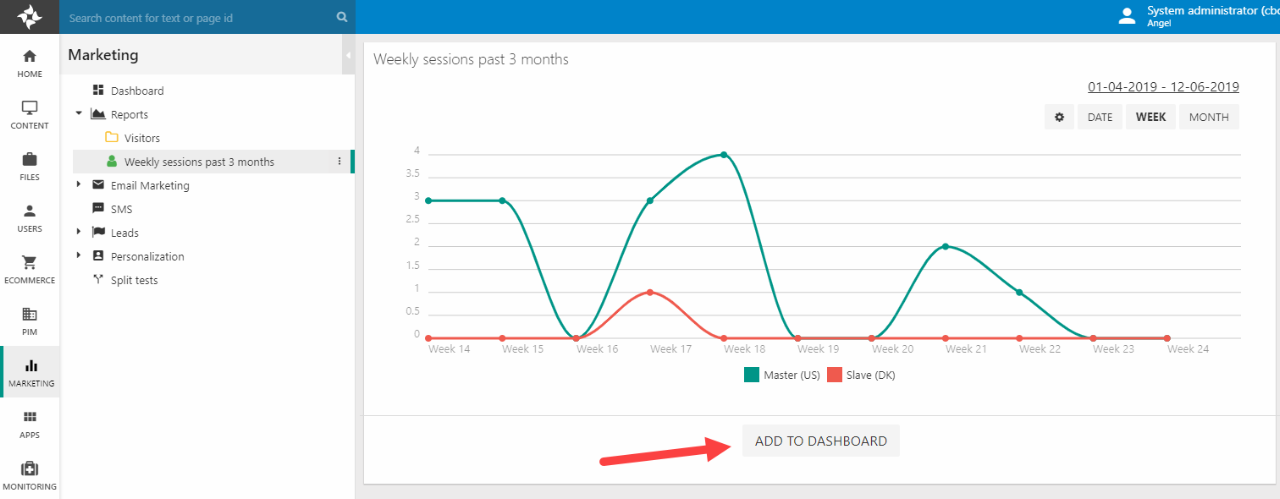
When a report has been created, you can click the Make dashboard widget button on the report to export it to the maketing dashboard (Figure 1.2).
Depending on your Dynamicweb version we may deliver a set of predefined reports - if we don't, you can install a clean version of Dynamicweb 9.8 or newer and review the predefined reports for inspiration.
Conversion reporting
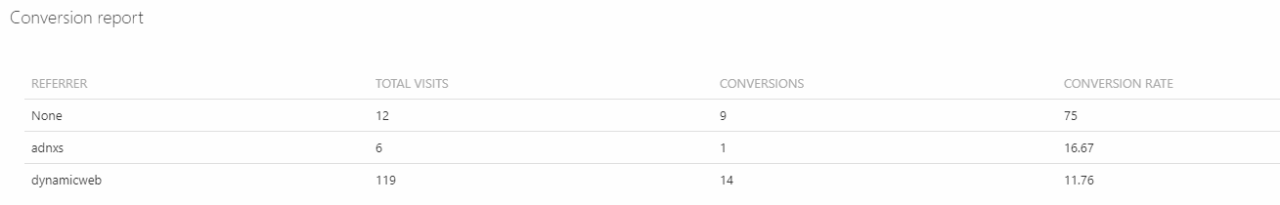
Conversion reports are reports which show the conversion rate of e.g. different devices in relation to a conversion parameter, e.g. Cart.Completed. This makes it possible to see reports on questions such as…
- How many mobile device users complete a purchase compared with desktop device users?
- How does the Danish website perform compared to the US website?
- Do returning customers place more orders per session than new customers?
When creating a conversion report you:
- Select a timespan to report on, e.g. 2 weeks
- Select a data grouping, e.g. Country, Platform, or Device.
- Select a conversion parameter such as Cart.Created
- Set up any filters you may want to apply, e.g. only reporting on specific websites, countries or campaigns
Conversion reports are always shown in a list format (Figure 2.1).
Funnel Reporting
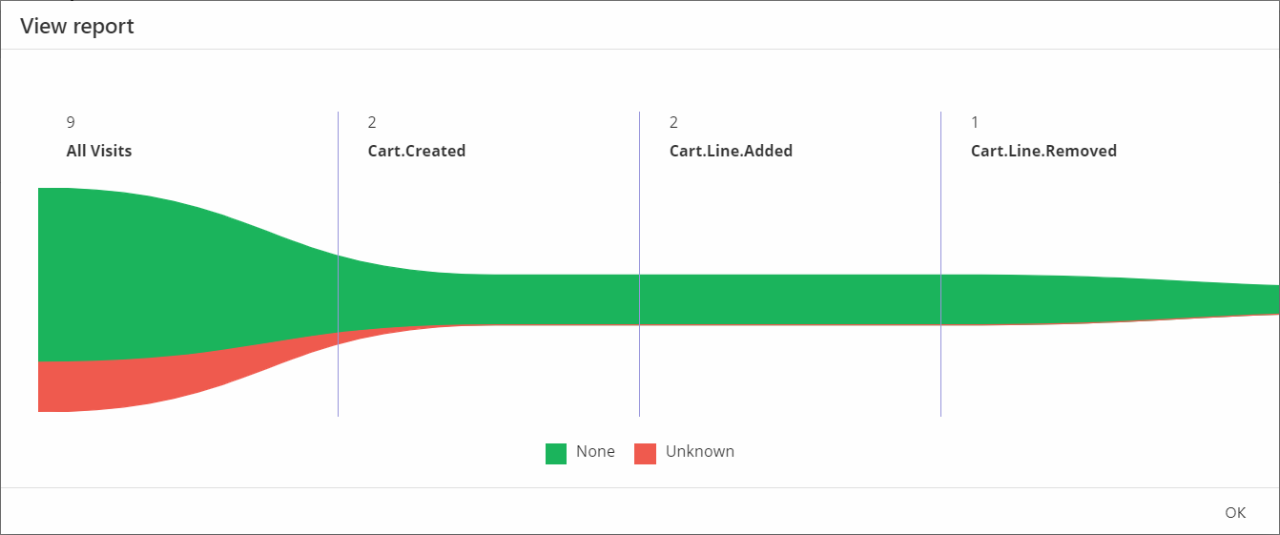
Funnel reports are reports which show how many percent of sessions complete various steps in a flow, e.g. Cart.Created, Cart.Checkout, and Cart.Completed.
When creating a funnel report you:
- Select a timespan to report on, e.g. 2 weeks
- Set a max data series number - the default is 5
- Specify a metric over time - a second dimension to track, e.g. referrer or device
- Define several steps to report on, e.g. Cart.Created and Cart.Completed
- Set up any filters you may want to apply, e.g. only reporting on specific websites, countries or campaigns
Funnel reports are always shown in a funnel chart format (Figure 3.1).
Session reporting
Session reports are reports which report various types of information about sessions or pageviews on a solution, e.g. most visited pages during the previous 3 months or weekly sessions per referrer.
When creating a session report you can:
- Select the basic parameters:
- A time range value, e.g. Current month, 2 weeks, etc.
- A time grouped by value, e.g. date, month by year, week by year, etc.
- A max dataseries value – defaults to 24
- A metric over time value – e.g. Country, Device, Page
- (Optional) Enable comparison and:
- Select a time span – if Previous period is selected the value from time range will be used
- Select a measurement type:
- Visits (may contain several page views)
- Page views
- Specify a rendering type:
- Number
- List
- Line chart
- Bar chart
- Pie chart
- Set up any filters you may want to apply, e.g. specific websites or countries.
Session reports is the most flexible report type around, which unfortunately also means that you have to use common sense when creating reports; only data grouped by timespan should use the line chart rendering type, etc.