
Insights
Insights is a marketing dashboard created to help you make data-driven business decisions, by making it easier to gauge which actions had what consequences:
- Why did sales go up Monday but down Tuesday?
- What impact did the marketing campaign last week have on the total order price?
The insights dashboard makes it easier to answer these kinds of (complex) questions by allowing you to dive into various statistics about the solution – see (Figure 1.1).
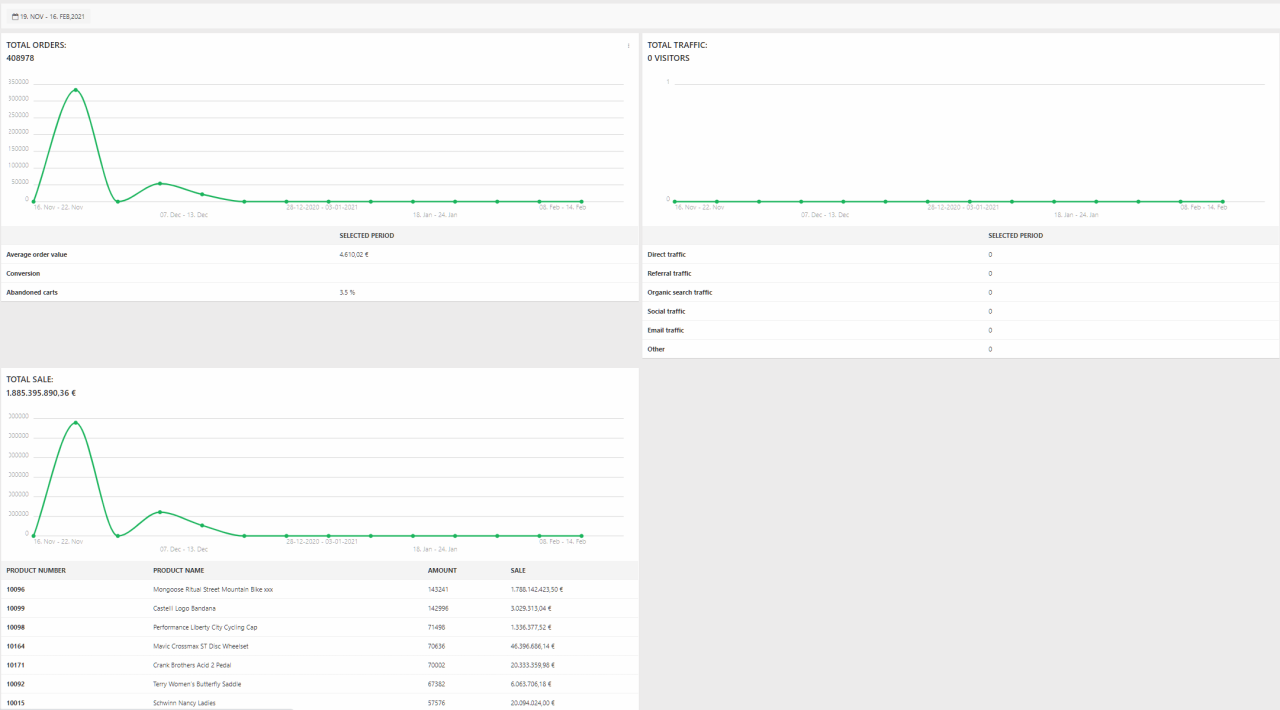
By default, the Insights dashboard contains widgets for exploring:
- Orders – total orders, average order value, conversion rate, abandoned carts percentage
- Traffic – direct traffic, referral traffic, organic traffic, etc.
- Sales – Total sale, most sold products
- Customers - new vs repeat
At the top of the insights page you have access tools for filtering insights data - e.g. by shop or by a specific timespan.
To select a timespan to explore:
- Click the data selector in the top left corner of the content pane
- Specify a date range
- (Optional) Check compare to previous dates and select a comparison date range.
- Click OK