Dashboards
A dashboard provides an at-a-glance view of key data and statistics on a solution such as order data, the total number of visitors, or query counts from e.g. PIM or user management. The information is displayed on a workspace via widgets.
The following Dynamicweb areas contain customizable dashboards:
- Home
- Ecommerce
- PIM
- Marketing
- Monitoring
Each of these dashboard contain a default workspace with a preconfigured widget layout. If the layout is changed, the changes are saved to the user to ensure a persistent experience across sessions and to make it possible to fit the dashboard to the needs of that particular user.
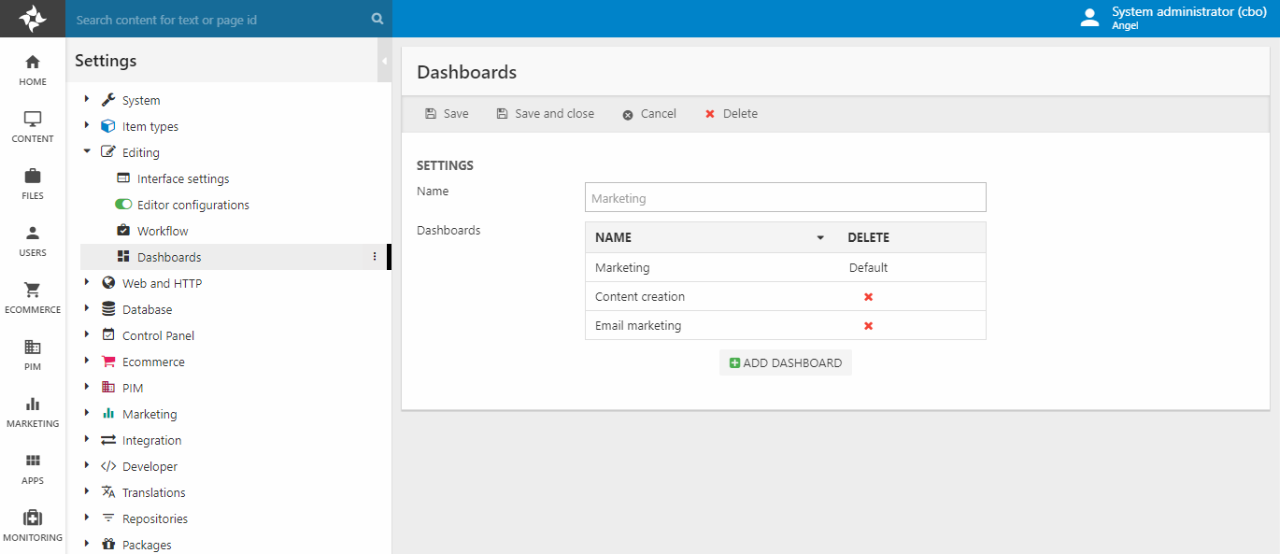
It is also possible to create additional workspaces for each area – these workspaces can also be customized. Both the default workspaces and the additional workspaces may be reset to the default layout. Additional workspaces are created from Settings > Dashboards under the area where the workspace should be listed (Figure 1.1).
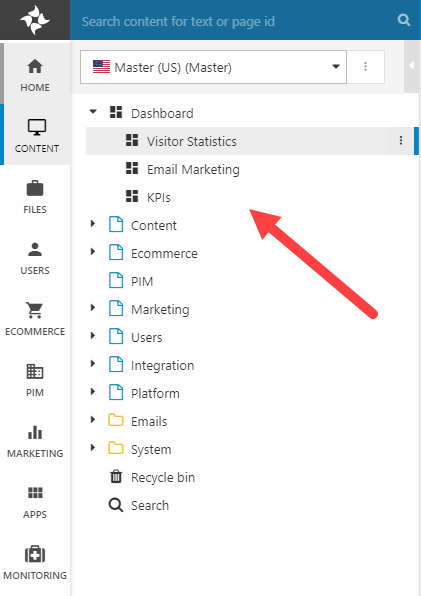
Once created, the Dashboard node under the relevant area folds out to reveal the new workspaces (Figure 1.2).
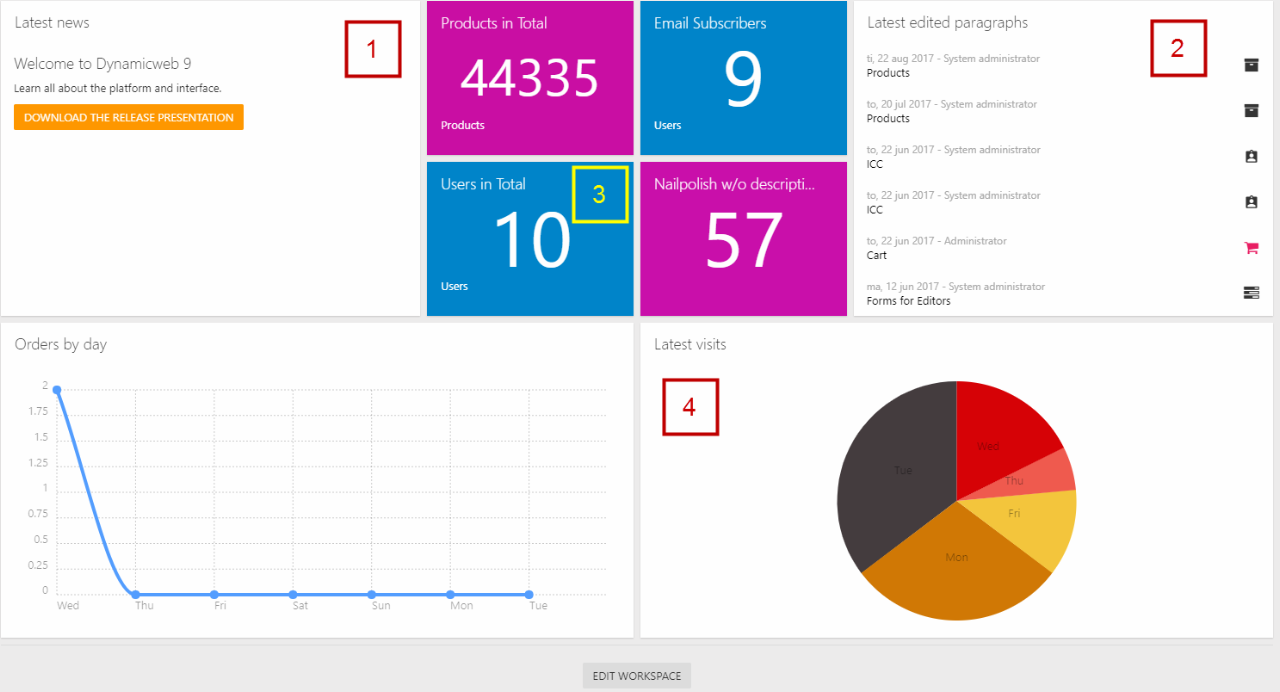
There are broadly four types of dashboard widgets (Figure 1.3):
- Feeds (1)
- Lists (2)
- Counters (3)
- Graphs (4)
There are also query widgets which can do all of the above, with data from an index query.
For each dashboard you can edit, remove, and add widgets to the workspace - the area where the widgets are shows - as you see fit:
- Click Edit Workspace to open edit mode (Figure 2.1)
- Click Add widget in the toolbar and select a widget
- (optional) Click the widget to open and edit the widget parameters
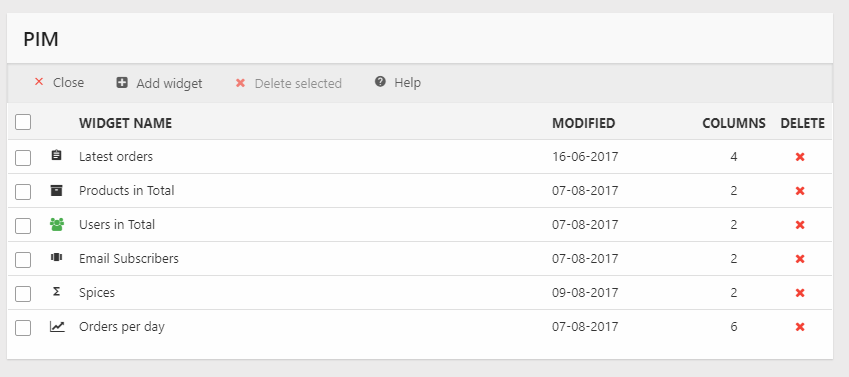
The workspace is divided into 12 columns, and the widget will be rendered according to their order on the widget list. Dynamicweb ships with a number of predefined widgets and widget types, some of which work out of the box, and others which must be configured before being useful.
Widgets
Dynamicweb ships with a number of preconfigured widgets for each dashboard, which can be added and used as is or with minimal configuration.
The following types of widgets exist:
- Feed widgets
- List widgets
- Counter widgets
- Graph widgets
- Query widgets
If the default widgets are inadequate in some way, it’s easy to create custom widgets. You can either open an existing widget and reconfigure it, or you can create new widgets from scratch.
All widgets have a Columns setting which can be used to change the width of the widget. A dashboard is 12 columns wide.
Feed widgets
A feed widget renders content from a feed or iFrame source on the dashboard.
|
Name |
Type |
Description |
Comments |
|
Feed widget |
Feed |
Renders content from a feed. |
Feed must publish data in the JSONP format (JSON with Padding) |
|
iFrame widget |
Feed |
Renders content in an iFrame |
Supply only an URL |
List widgets
List widgets can render key data in list format, with a link to an appropriate frontend or backend location.
|
Name |
Type |
Description |
Comments |
|
Latest created orders |
List |
Lists the most recently placed orders on the solution |
|
|
Latest created users |
List |
Lists the most recently created users on the solution |
|
|
Latest edited paragraphs |
List |
Shows the most recently edited paragraphs on the solution |
|
|
Latest visits |
List |
Shows the most recent visits to the frontend |
|
| Events - list | List | Shows a list of the most recent system events | Use parameters to control the event level, category, and time period covered |
| Scheduled task - list | List | Lists the most recently run scheduled tasks | Can be configured to include only tasks of a certain type, tasks which failed, etc. |
| Index list widget | List | Lists indexes with their current status | Can be configured to include only indexes from a particular repository, and with a certain status (Error, Success, Warning). |
Counter widgets
Counter widgets count something – naturally.
|
Name |
Type |
Description |
Comments |
|
Pages in total |
Counter |
Shows a count of the total number of pages on the solution |
Use parameters to select a specific website |
|
Products in total |
Counter |
Shows a count of the total number of products on the solution |
|
|
Summed orders |
Counter |
Shows the sum of all orders on the solution within a certain timespan |
Use parameters to set a timespan – e.g. 1 day, 1 week, or 1 month. |
|
Total orders in the solution |
Counter |
Shows a count of the total number of orders on the solution within a certain timespan |
Use parameters to set a timespan – e.g. 1 day, 1 week, or 1 month. |
|
Total visits in the solution |
Counter |
Shows a count of the total number of visits to the solution within a certain timespan |
Use parameters to set a timespan – e.g. 1 day, 1 week, or 1 month. |
|
Total number of users with “email allowed” |
Counter |
Shows a count of the total number of users on the solution with Email allowed |
|
|
Users in total |
Counter |
Shows a count of the total number of users on the solution |
|
| Events – count | Counter | Shows a count of the total number of events of a certail level and category | |
| Scheduled task - count | Counter | Shows a count of the total number of scheduled tasks with a particular status | Can be configured to include only tasks of a certain type, tasks which failed, etc. |
| Index count Widget | Counter | Shows a count of indexed with a particular status | Can be limited to a single repository. Can count indexes builds with status Error, Success or Warning. |
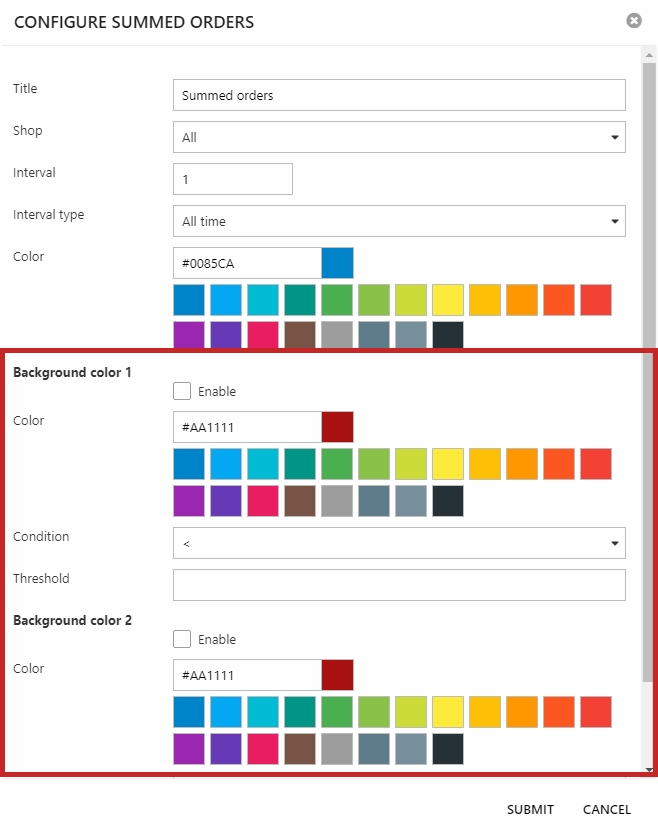
They may or may not have widget-specific parameters, but they all support changing the widget color based on various thresholds (Figure 6.1).
This makes it possible to provide instant feedback on the state of KPI’s such as daily turnover, weekly visitors, etc.
Graph widgets
Graph widgets render data in a bar, line, or pie format.
|
Name |
Type |
Description |
Comments |
|
Orders by day |
Graph |
Shows a graph of the orders placed within the last 7 days |
|
|
Latest created users |
Graph |
Shows a graph of the users created per day within the past 7 days |
|
|
Latest visits |
Graph |
Shows a graph of the visits per day within the past 7 days |
|
| Events by day | Graph | Shows a graph of the total number of events per day of a certain level and category |
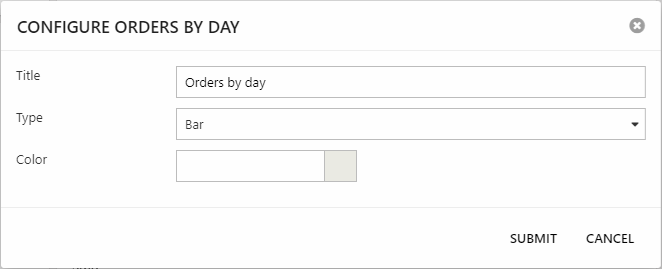
You can use the type parameter to select the type of graph (Figure 7.1). The color parameter is only relevant for graphs of the type bar and line.
Query widgets
Query widgets present data returned by an index query -
|
Name |
Type |
Description |
Comments |
|
Query Counter Widget |
Counter |
Displays data returned by a query, e.g. products. Can count data, or sum/average the value of a specific field. |
You can use the Parameters field to pass parameters & values to the query in string format. |
|
Query Facet Widget |
Graph |
Renders facet options for a particular facet in a graph-format, e.g. a pie chart of the values in the Manufacturer field. |
You can use the Parameters field to pass parameters & values to the query in string format. |
|
Query Grid Widget |
List |
Renders a preview of a query result in table form |
Deprecated |
|
Query List Widget |
List |
Renders data from a query in list format |
Use parameters to select a title field, a hint field, and a right-field to display. You can use the Parameters field to pass parameters & values to the query in string format. |
Except for the facet widget, query widgets can be clicked to go directly to the query, product, etc.
SQL query widgets
SQL query widgets present data returned by an SQL query.
|
Name |
Type |
Description |
Comments |
|
SQL Query Counter Widget |
Counter |
Displays data returned by an SQL query, e.g. products. Can count data of a specific field. |
|
|
SQL Query Table Widget |
List |
Renders data from an SQL query in list format |
You can specify the number of records (max 500) shown in the list. |
As of Dynamicweb 9.10 you can use certain contextual values in the SQL statements - e.g. {ProductId}:
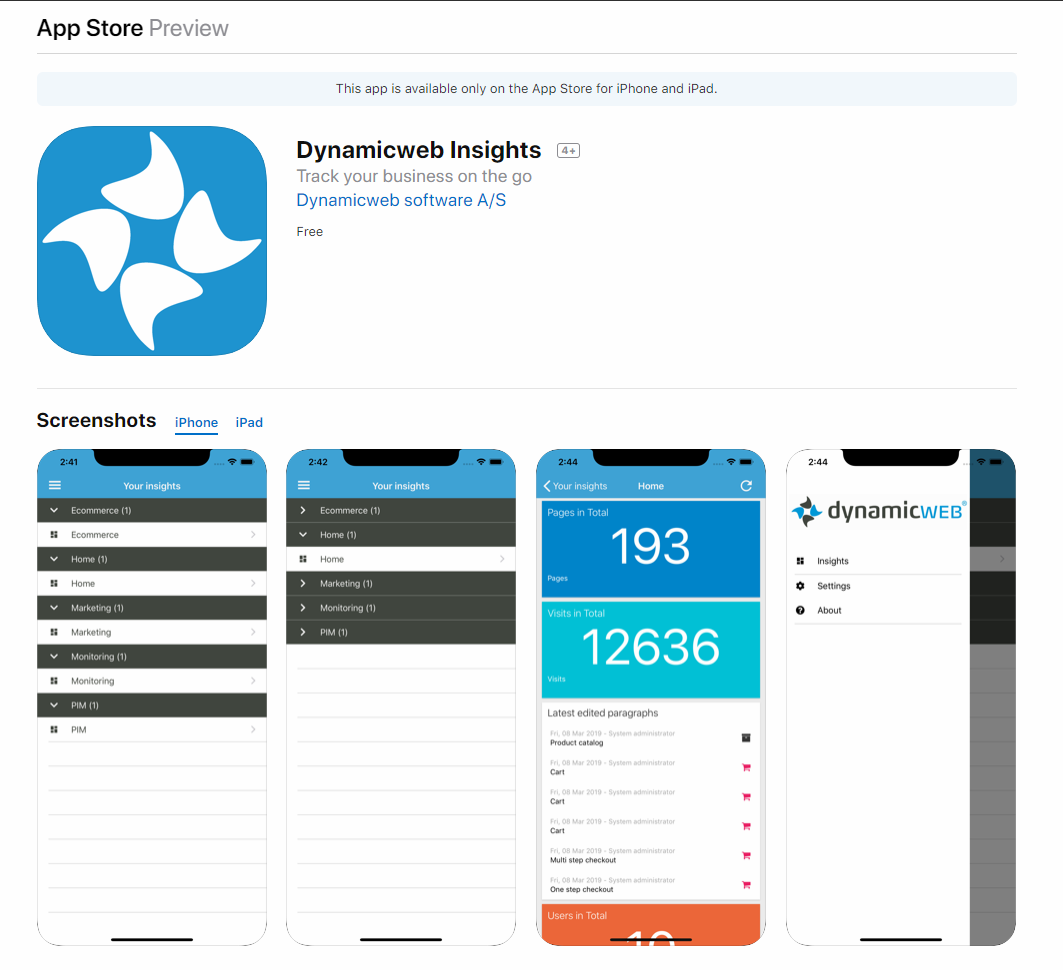
Dynamicweb Insights mobile app
Dynamicweb Insights is a mobile app available for Apple and Android phones. It allows you to connect to a Dynamicweb solution and:
- Access your personalized Dashboards
- View your website traffic and performance
- Keep track of your website conversions
- Switch between daily, weekly, monthly, and yearly views of your data
- Add notifications for new payments, subscriptions, downloads, etc.
For more information please see the Apple App Store and Google Play store.