
Monitoring
The Monitoring Center is a feature which allows you to:
- Monitor system events
- Monitor data health
- Set up notifications to alert key people when certain events occur
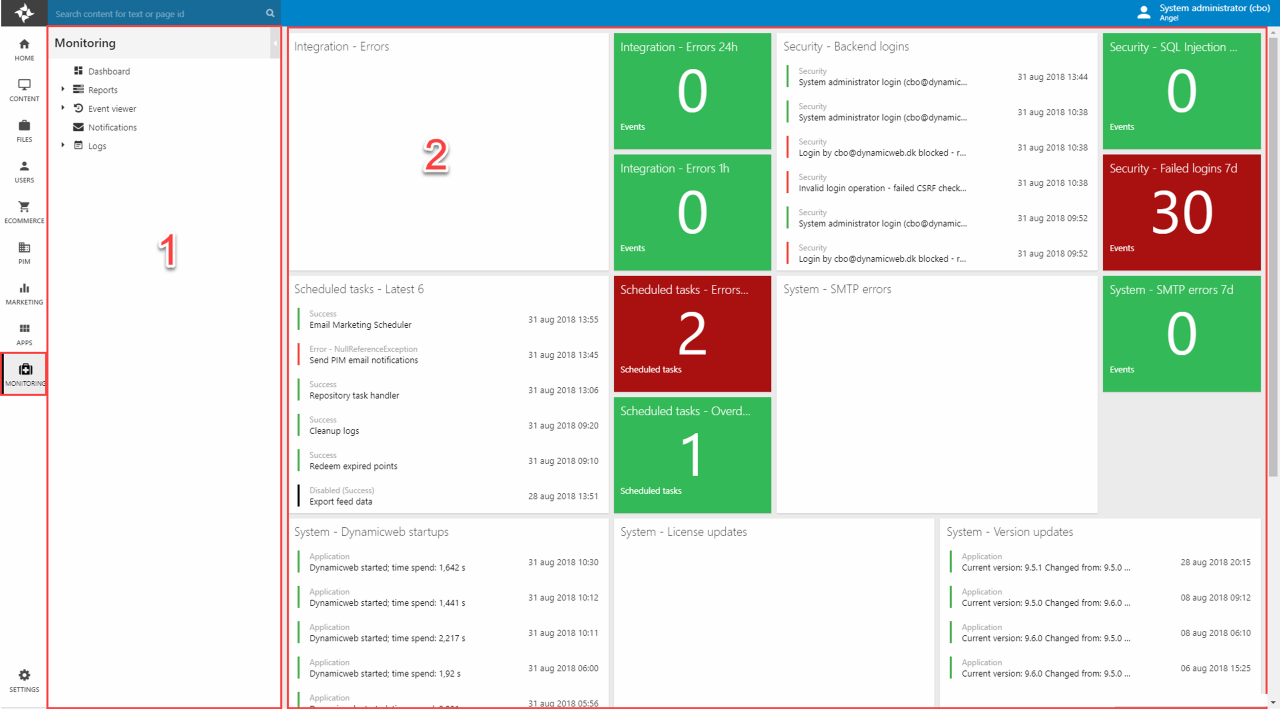
If included in your license, the Monitoring center is available from the area menu (Figure 1.1) – and consists of:
- An area tree (1)
- A content pane, here showing the Monitoring dashboard (2).
The monitoring center is only available for certain licenses – for more information please contact support@dynamicweb.dk
Dashboard
The Monitoring dashboard is a regular dashboard preconfigured to show the state of various important system events such as:
- Scheduled task runs
- License updates
- SMTP errors
- Backend logins (incl. Failed logins)
- Etc.
Like all dashboards, you can add and remove widgets as you please – see the dashboards article for more information.
Reports
The Reports node provides you with two things:
- Easy access to scheduled tasks and integration activities
- A preconfigured view of SMTP- and Security-related events
For information about scheduled tasks and the data integration module, please see the general documentation.
Event Viewer
The Event viewer node provides you with quick and preconfigured access to lists of system events:
- All - lists all system events
- Errors - lists events classified as errors including failing SQL statements
- Warning - lists events classified as warnings
- Information - lists events classified as information
All lists share the same basic interface– the most recent event is shown at the top, a toolbar allows you to filter or search the list in various ways, and you can click use the Email notification button to create notifictions.
Read more about the event viewer.
Health
The Health node provides you with an at-a-glance view of data health on the solution, by identifying potential issues such as:
- Orphaned pages and paragraphs
- Products which don’t exist in the default language
- Broken list item references
- Etc.
Currently three different areas are monitored:
- Content data
- Ecommerce data
- Security settings
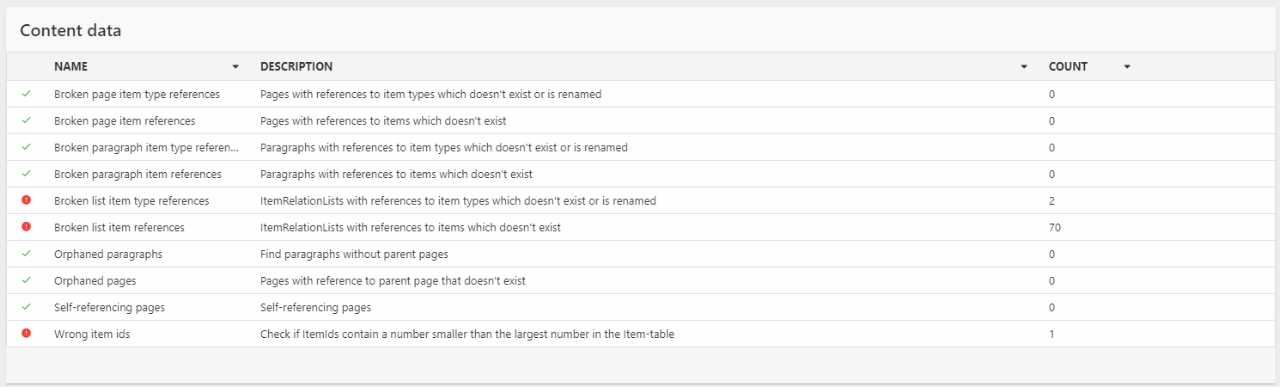
Click either of these nodes to see list of checks associated with the area – in Figure 5.1 you can see the checks for content data.
Each check can be examined in detail by clicking it and reviewing the detail information (Figure 5.2).
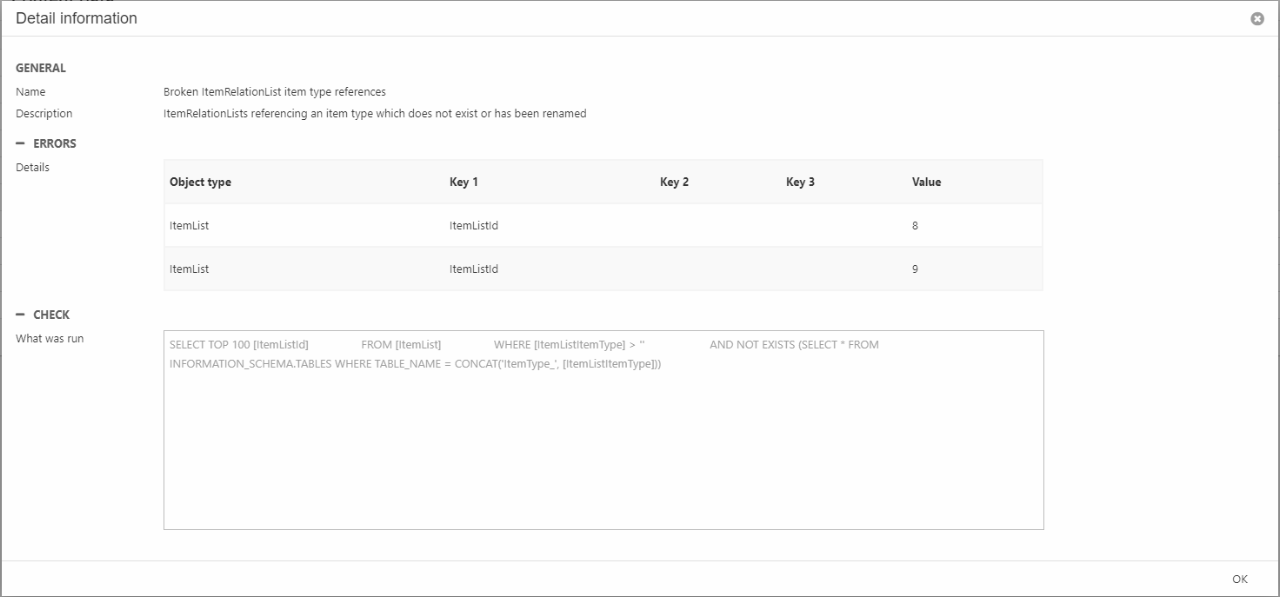
When viewing the check details you can see:
- The check name and description
- A list of issues found – in this case two instances of an item relation list which reference an item type that no longer exists
- The SQL query used to find the issues
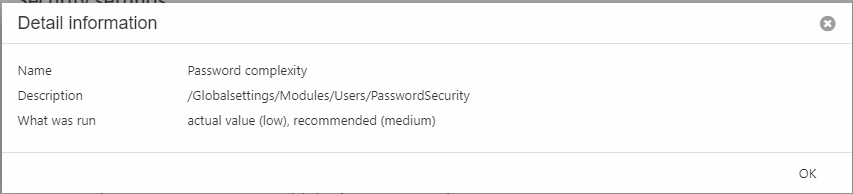
If you’re reviewing the security settings you will instead see the the actual value compared to the recommended value (Figure 5.3).
Notifications
Event viewer notifications are emails which are sent to key people when a certain system event occurs. The notifications can be configured quite extensively, which makes it possible to set up notifications for key parts of the solution separately, and with varying degrees of urgency.
To create a notification click Notifications in the area tree to open the notifications list (Figure 6.2).
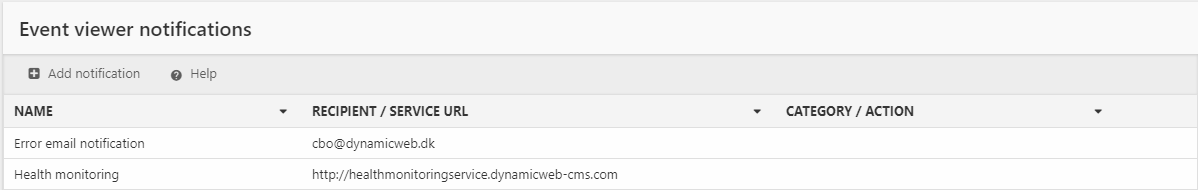
From the notifications list you can:
- Click an existing notification to review and/or edit it
- Click add notification to create a new notification (Figure 6.3).
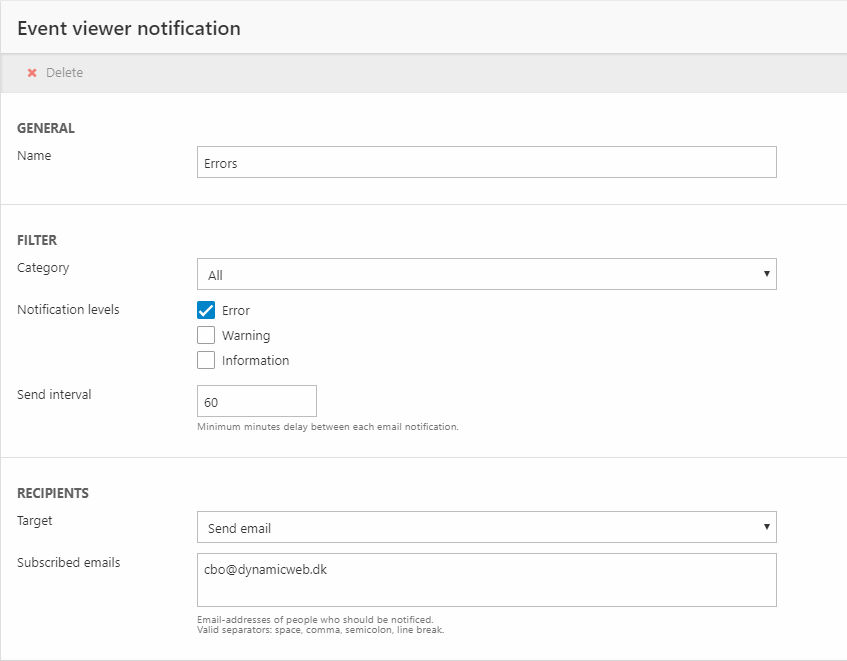
To configure the notification:
- Provide a name
- Configure the filter section:
- Select a category (or leave as All)
- Select the notification levels to include
- Specify a send interval defined as the minimum delay between notifications
- Specify recipients:
- Send Email notifies a list of emails
- Health monitoring service notifies a monitoring service
Logs
The Logs node is a conveniently located shortcut to the Logs tool available from Settings > Logs – it is used for:
- Deleting file & database logs automatically
- Browsing logs
Read more in the Logs documentation.