Search Statistics
As of Dynamicweb 9.9, you can activate the collection of search statistics for each query used in frontend. Please note that this requires you to activate tracking.
When a query is tracked we track the following:
- The query being searched
- The parameters being searched
- The value being searched for
- The number of results returned
- The last query time
To activate search statistics for a specific query:
- Open the app using the query – e.g.:
- Query Publisher
- Product Catalog for ViewModel
- Product Catalog
- Check the Track queries for statistics checkbox
Once this is done the system will start collecting statistics for the queries.
To browse the statistics collected go to Settings > Repositories > Statistics – you will see a list of queries on the system (Figure 1.1).
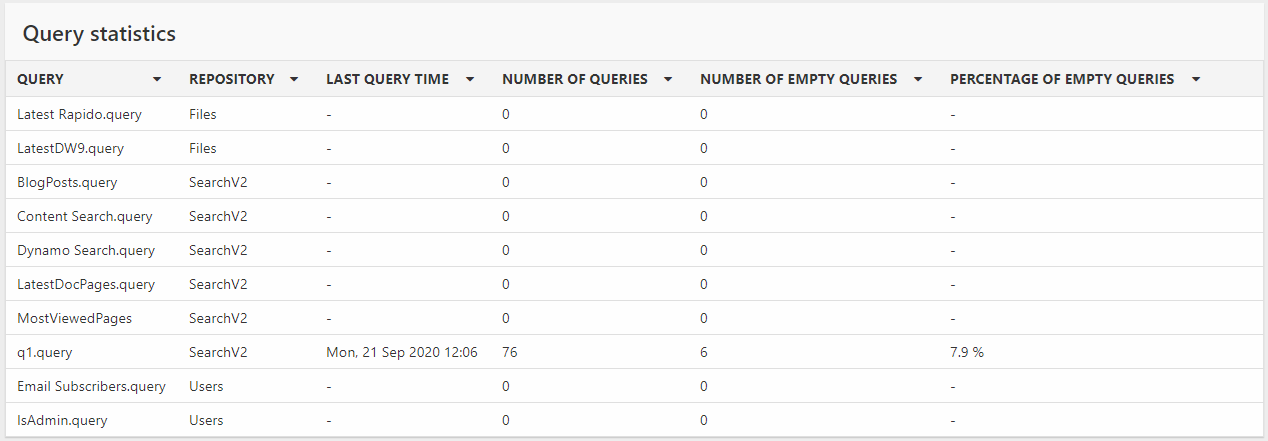
For each query you can see some key data:
- Repository
- Last query time
- Number of queries
- Number of empty queries
- Percentage of empty queries
Each query can be clicked to open a more detailed view (Figure 1.2).
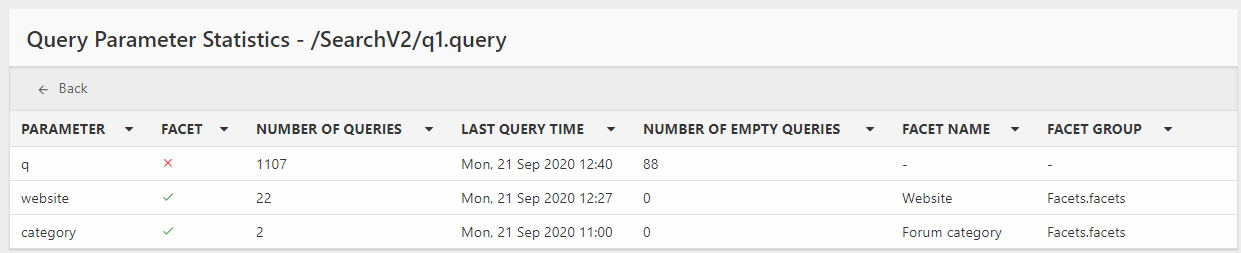
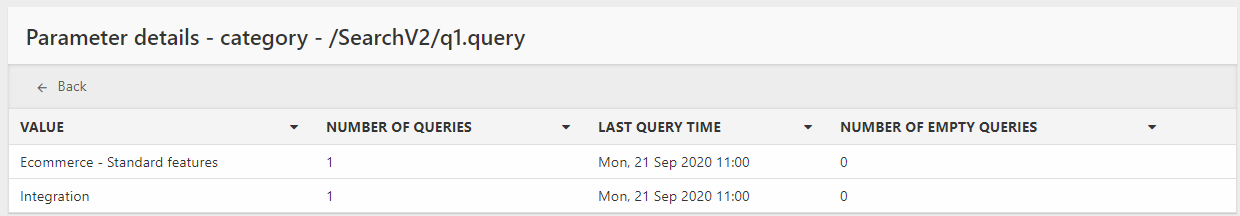
From this view you can see each query parameter, facet information, and of course the number of queries and empty queries. Each parameter can be clicked to open a more detailed view of the search terms used (Figure 1.3). You can see the value, the number of queries, the last query time, and the number of empty queries.